
Visualizing BIG numbers…
I just listened to Chris Jordan’s TED presentation: Turning powerful stats into art.
The presentation is very good, but one particular item kind of stuck with me…
How many papercups does our society use servicing hot beverages per day ?
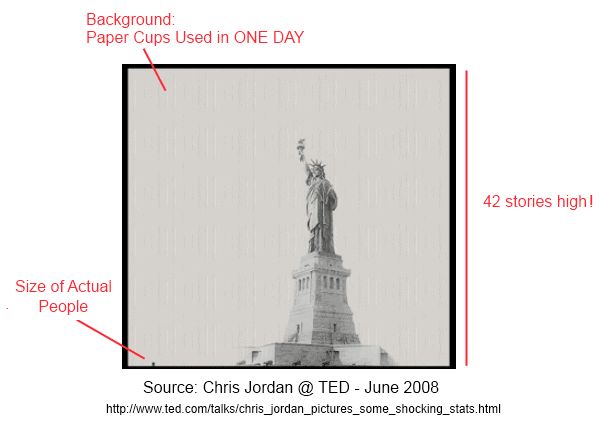
40 Million cups!
That does not sound like much until one begins to *visualize the data” in some sort of context, and for me, he did it!.. On a daily bases, we use over a mile, 42 stories high of paper cups… That is a crazy amount… (See graphic on right)
This TED session, made me want to go a research a bit more about Chris… As it turns out, Chris Jordan is a Seattle-based photographer with a social cause. His is known for his large scale works depicting mass consumption and waste.
I would encourage you to check his current work at his site: chrisjordan.com –
( Side note: for the “no-so-weak-at heart”, his collection: midway Message from the Gyre will leave you thinking! )


